Chapter 1 Limit, Continuity and Derivative-I
1.1 Exercise 1 (i)
1.1.1 Question 1
Find the domain of the following functions:
- \(\boldsymbol{y=x^2-4x}\)
It is a polynomial function. Every real number \(\mathbb{R}\) satisfies the equation. So the domain is \(D(f)=(-\infty, \infty)\).
- \(\boldsymbol{y=\frac{1}{x+2}}\)
Here \(x\) can be anything except a value that produces a zero in the denominator i.e \(x+2\neq 0\) or \(x\neq -2\). So the domain is \(D(f)=(-\infty,-2)\cup (-2,\infty)\).
- \(\boldsymbol{y=\sqrt{3-x}}\)
Here
\[\begin{equation*} \begin{split} 3-x \geq 0\\ x \leq 3 \end{split} \end{equation*}\]
Therefore, the domain is \(D(f)= (-\infty,3]\).
- \(\boldsymbol{y=\frac{1}{\sqrt{1-x^2}}}\)
Here \(1-x^2\) should be \(>0\) i.e.
\[\begin{equation*} \begin{split} 1-x^2 > 0\\ x^2 < 1\\ -1<x<1 \end{split} \end{equation*}\]
Also \(1-x^2\) can’t be zero.
\[\begin{equation*} \begin{split} 1-x^2 & \neq 0\\ x^2 & \neq 1\\ x & \neq \pm 1 \end{split} \end{equation*}\]
Thus, the domain is \(D(f)=(-1,1)\).
- \(\boldsymbol{y=\sqrt{3-4x+x^2}}\)
Here
\[\begin{equation*} \begin{split} 3-4x+x^2 \geq 0\\ (x-1)(x-3) \geq 0 \end{split} \end{equation*}\]
Now, when \(x\) is \(\leq 1\) in the number line, LHS is satisfied.
When \(x\) lies between \((1,3)\), LHS becomes negative and won’t satisfy the equation.
When \(x\) is \(\geq 3\), LHS is satisfied. Hence the domain of the function is \(D(f)=(-\infty,1]\cup [3,\infty)\).
- \(\boldsymbol{y=\frac{x}{x-1}}\)
Here \(x-1\) can’t equal zero i.e \(x-1\neq 0\) or \(x\neq 1\). The domain is thus \(D(f)=\mathbb{R}-\{1\}\).
Finding range of a function
A. Method 1
- Plot the graph (use all techniques of shifting, stretching, compression)
- Range will be the value along \(y\)-axis
B. Method 2
- Put \(y=f(x)\)
- Express \(x\) as a function of \(y\)
- Find possible values for \(y\) (just like domain)
- Eliminate values by looking at the definition to write the final range
1.1.2 Question 2
Find the domain and the range of the following functions:
- \(\boldsymbol{y=\frac{1}{x-2}}\)
Here \(x-2\) can’t equal zero i.e \(x-2\neq 0\) or \(x\neq 2\). The domain is thus \(D(f)=\mathbb{R}-\{2\}\).
Plotting shows that the range of the function (the values along \(y\)-axis) is \((-\infty,0)\cup(0,\infty)\).
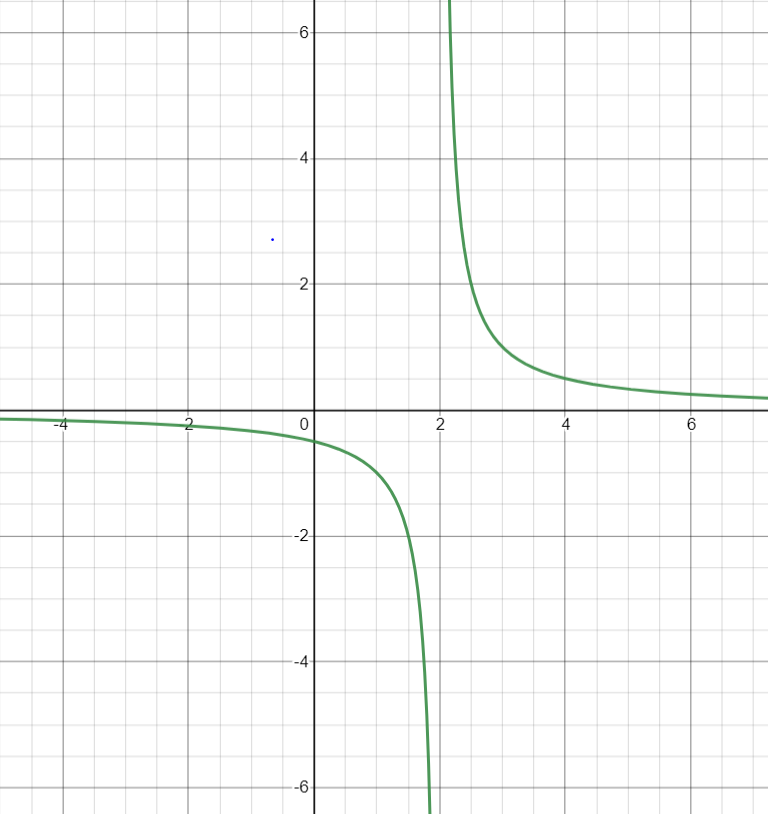
Figure 1.1: Plotting of \(y=\frac{1}{x-2}\)
- \(\boldsymbol{\sqrt{x-1}}\)
Domain: The function must be \(x-1\geq 0\). So \(x \geq 1\). Domain is thus \(D(f)=[1,\infty)\).
Range: Plotting \(y=f(x)=\sqrt{x}\) shows the graph above \(x\)-axis. Plotting \(f(x-1)=\sqrt{x-1}\) shifts the curve \(1\) unit to the right.
The range is thus \(R(f)=[0,\infty)\).
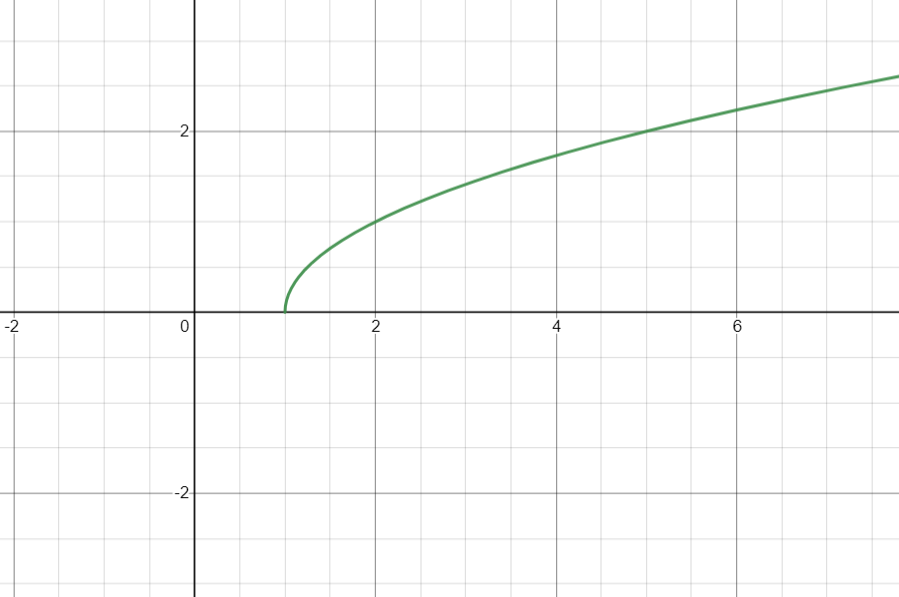
Figure 1.2: Function \(y=\sqrt{x-1}\)
- \(\boldsymbol{y=\sqrt{25-x^2}}\)
Domain: For the given function \(25-x^2\) should be \(\geq 0\).
\[\begin{equation*} \begin{split} 25-x^2 \geq 0\\ x^2 \leq 25\\ -5 \leq x \leq 5 \end{split} \end{equation*}\]
So the domain is \(D(f)= [-5,5]\).
Range: Plotting shows the function to be half circle above \(x\)-axis. The range is thus values along the \(y\)-axis i.e \(R(f)=[0,5]\).
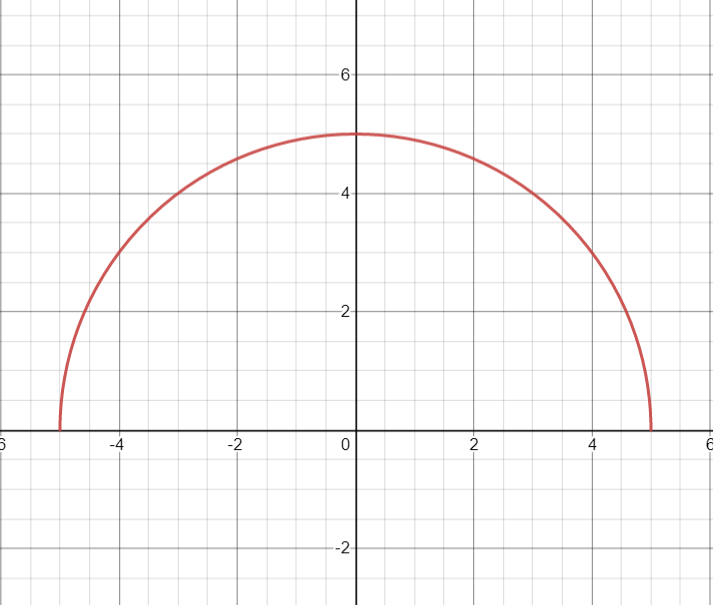
Figure 1.3: \(y=\sqrt{25-x^2}\)
- \(\boldsymbol{y=\frac{x^2-25}{x-5}}\)
Domain: Here \(x-5 \neq 0\), so \(x\neq 5\). Domain is thus \(D(f)=\mathbb{R}-\{5\}\).
Range: Plotting the equation gets a line \(y=x+5\) except a hole at point \((5,10)\). Range is therefore \(R(f)=(-\infty,10)\cup (10,\infty)\) or \(\mathbb{R}-\{10\}\).
1.1.3 Question 3
Draw the graphs of the following functions:
- \(\boldsymbol{y=\left|x\right|+\left|x-1\right|}\)
When \(x<0\),
\[\begin{equation*} \begin{split} y &= -x-(x-1) \\ &= -2x+1 \end{split} \end{equation*}\]
When \(0<x<1\),
\[\begin{equation*} \begin{split} y &= x-(x-1)\\ &= 1 \end{split} \end{equation*}\]
When \(x>1\),
\[\begin{equation*} \begin{split} y &= x+x-1\\ &= 2x-1 \end{split} \end{equation*}\]
The graph is thus plotted as below:
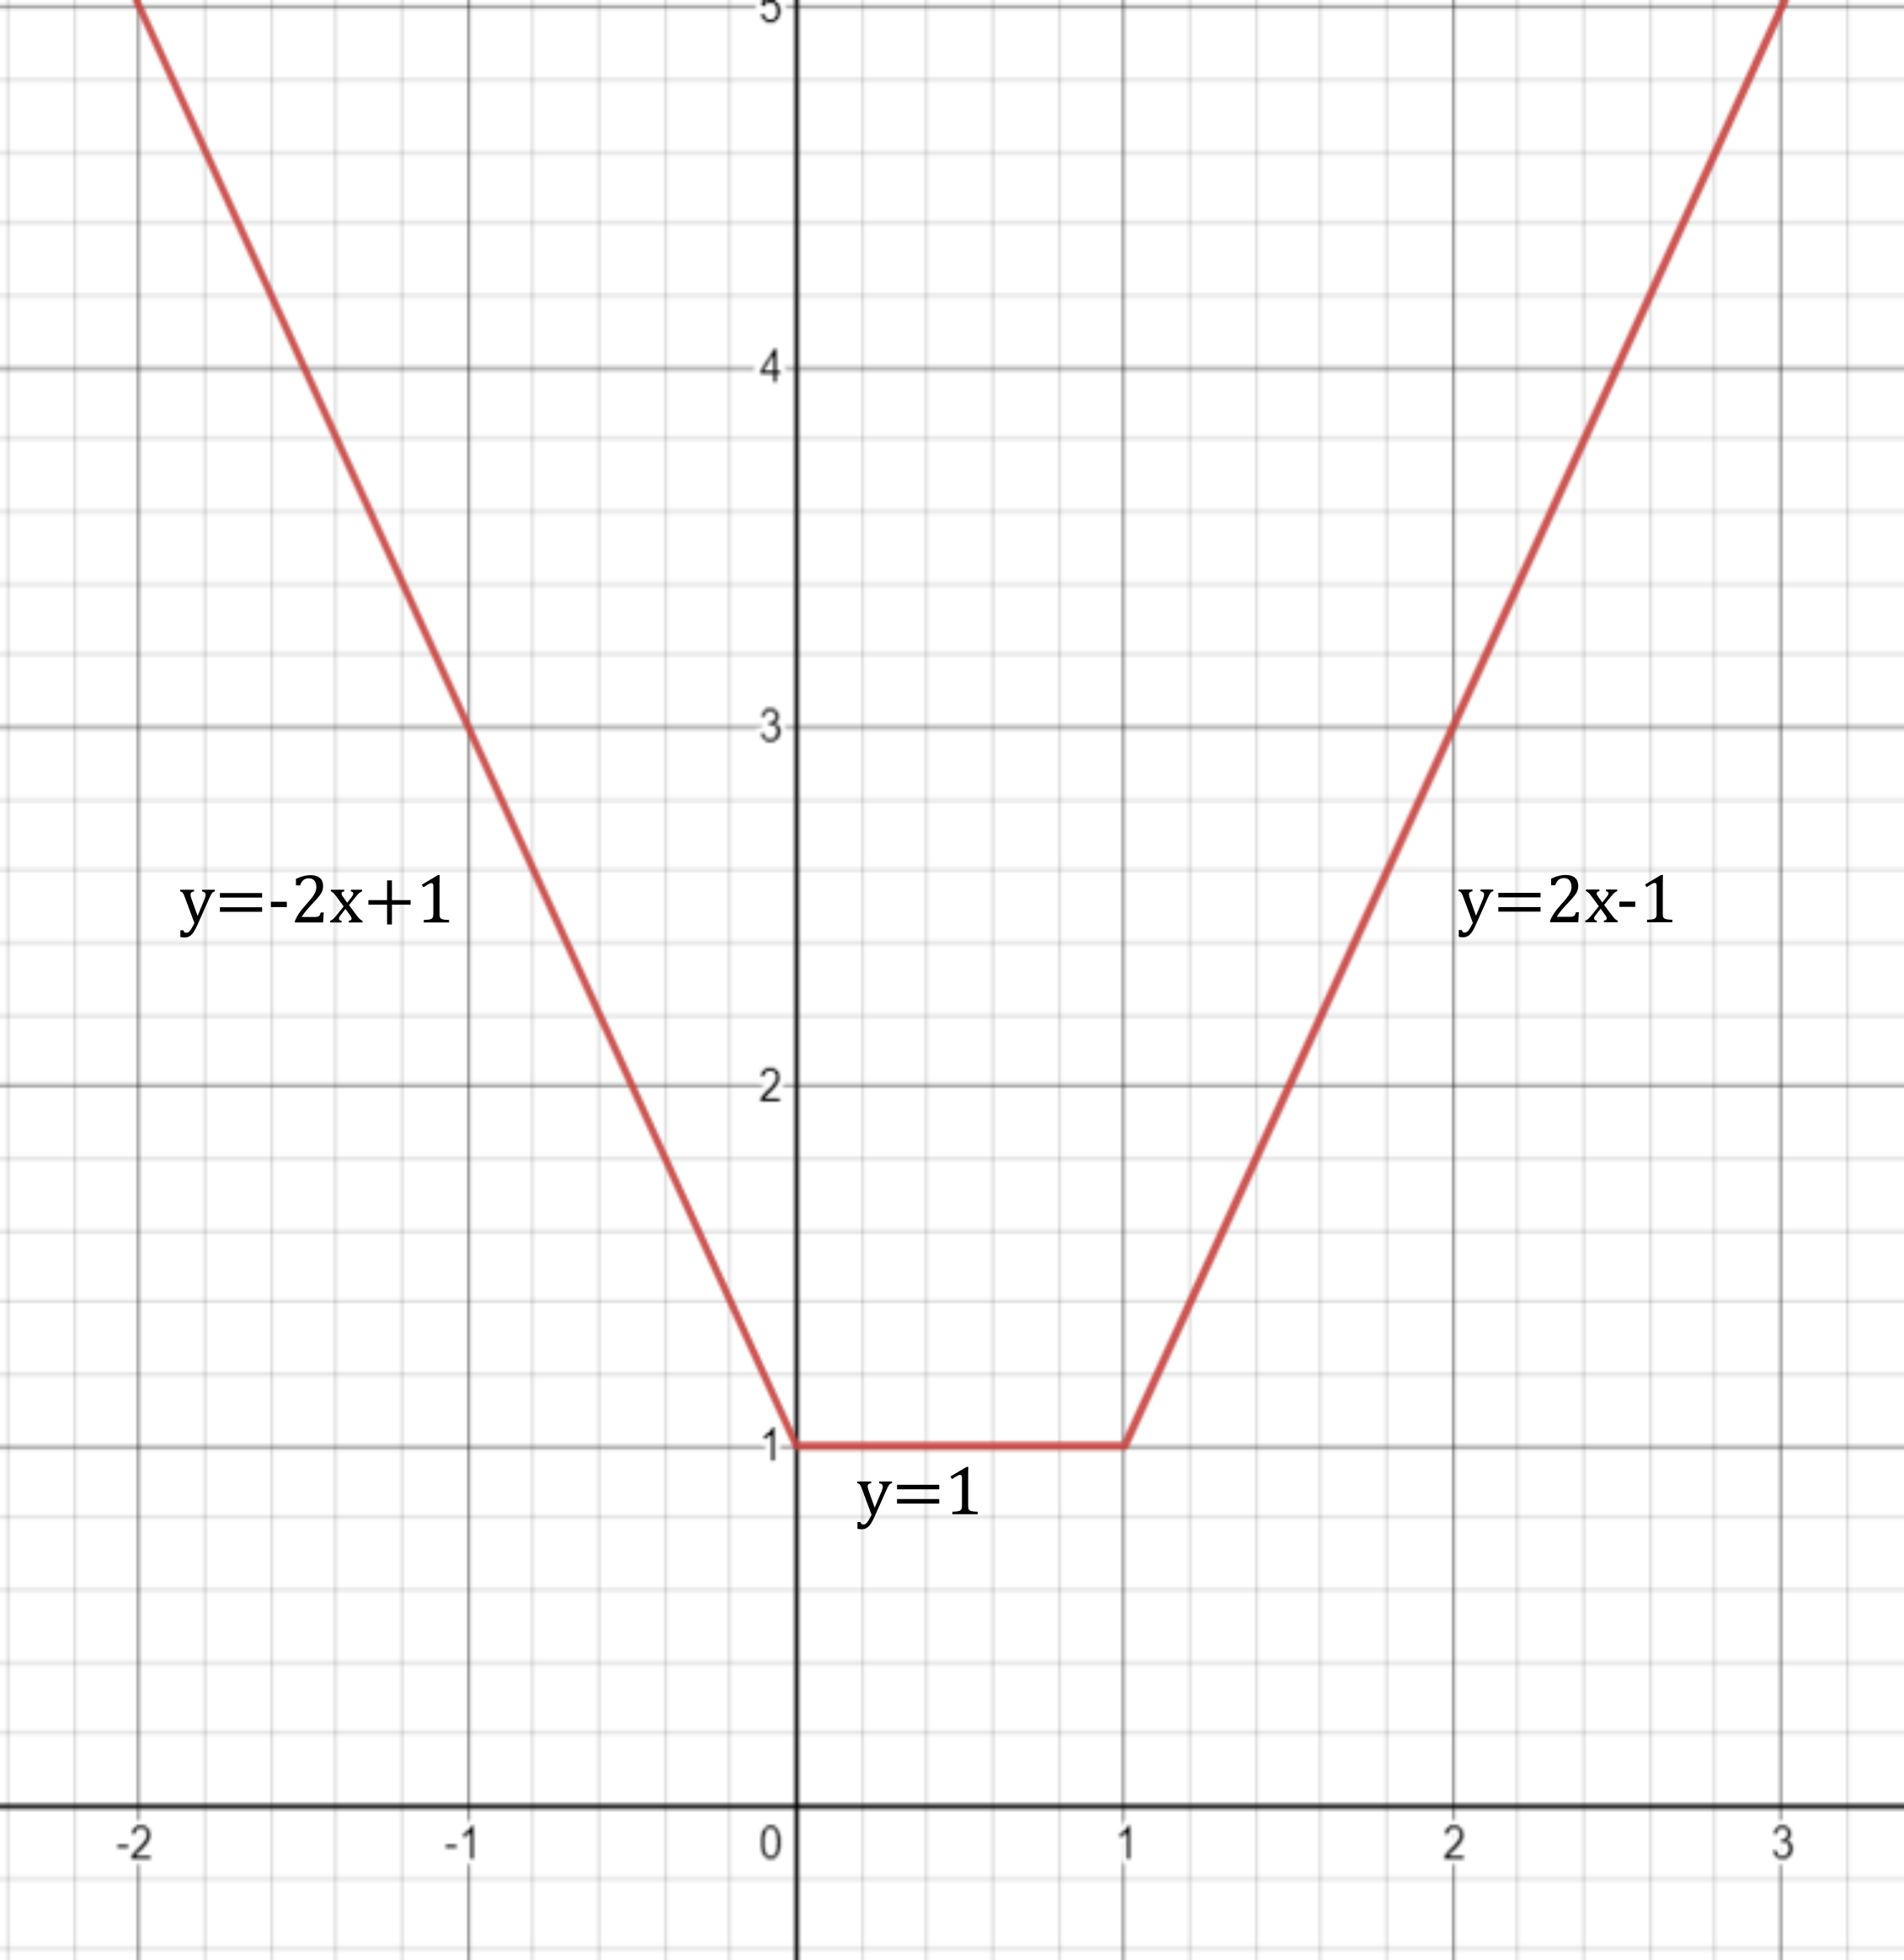
Figure 1.4: \(y=|x| + |x-1|\)
\(\boldsymbol{y=\left[x\right], x>0}\)
\(\boldsymbol{y=\frac{x^2-1}{x-1}}\)
For \(x \neq 1\), \(y=x+1\) which is a straight line not passing through the point \((1,2)\) i.e hole at this point. The graph is given below:
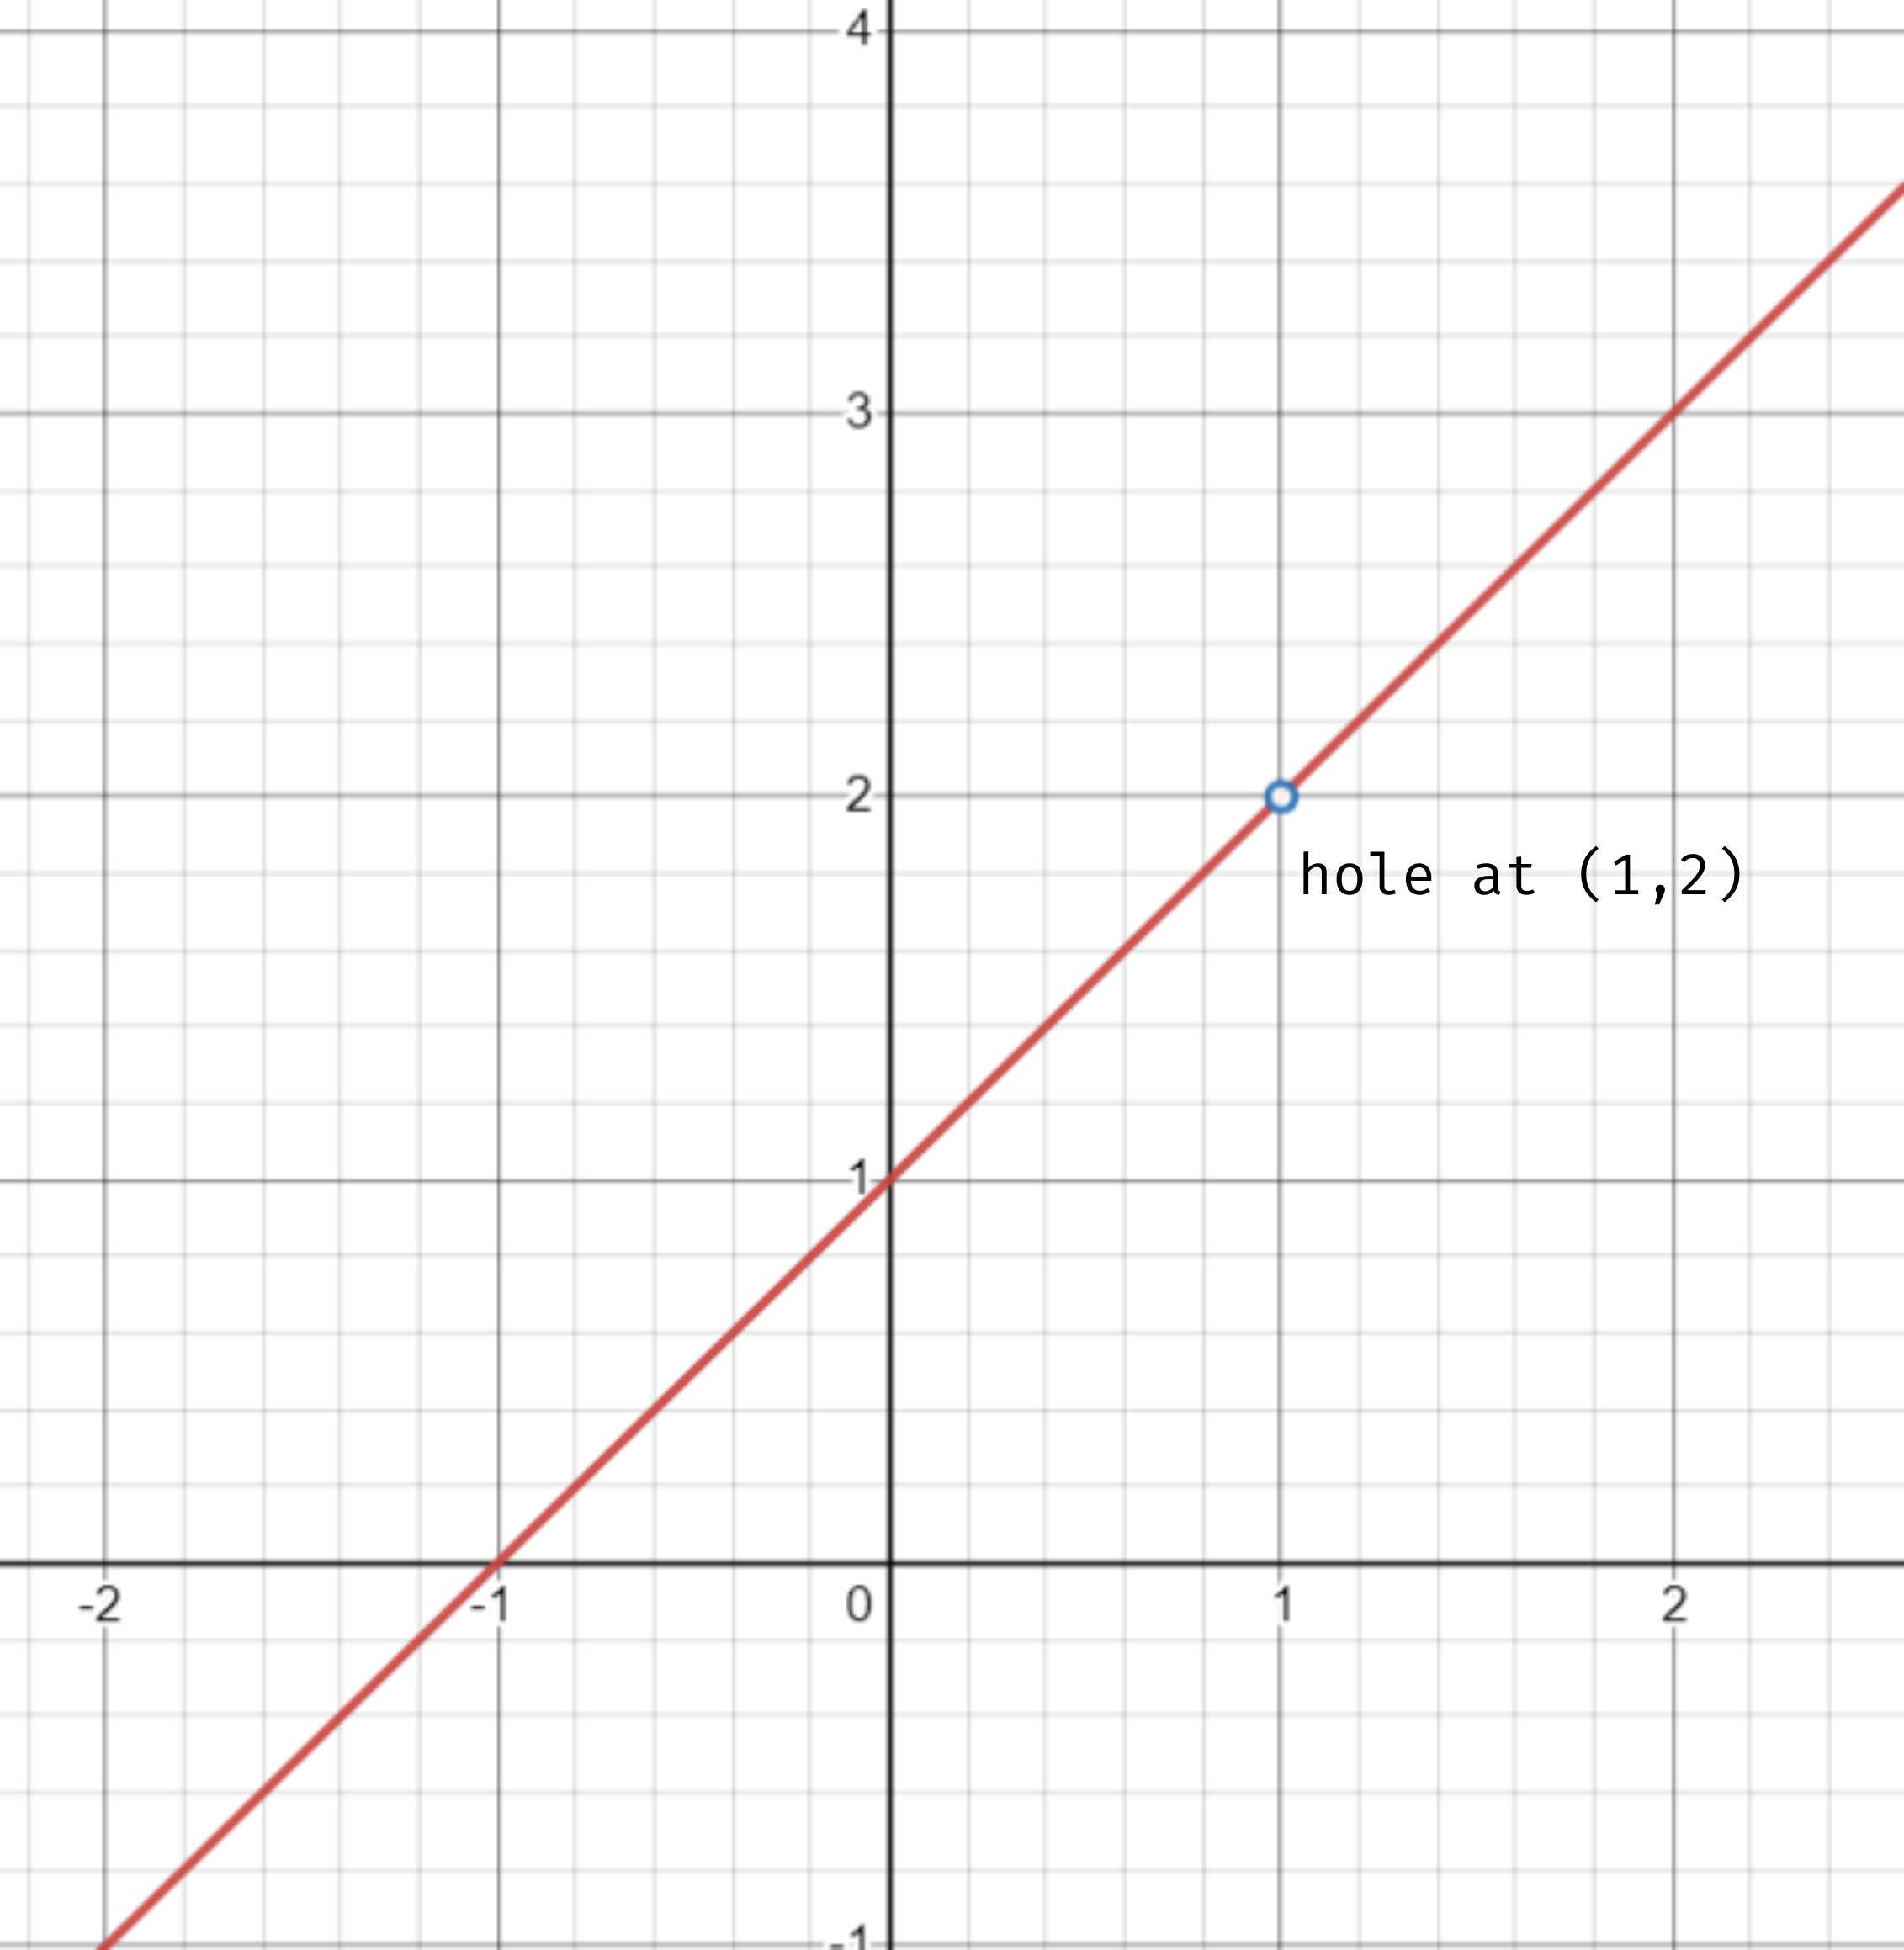
Figure 1.5: \(y=\frac{x^2-1}{x-1}\)
- \(\boldsymbol{f(x) = \begin{cases} x\phantom{-} & \text{if } x\leq 0\\ x^2 & \text{if } 0<x<2 \end{cases}}\)
When \(x\leq 0\), \(f(x)\) is a straight line with slope \(1\) passing through origin.
When \(0<x<2\), the \(f(x)\) is a parabola with concavity upwards. The graph is shown below:
1.2 Exercise 1(ii)
1.2.1 Question 1
Find the limits of the following:
\(\boldsymbol{\lim_{x \to 0+0} \left|x\right|}\)
\(\boldsymbol{\lim_{x \to 0+0} \frac{1}{x}}\)
\(\boldsymbol{\lim_{x \to 0-0} \frac{1}{x}}\)
\(\boldsymbol{\lim_{x \to 0} \frac{1+2^{1/x}}{3+2^{1/x}}}\)
\(\boldsymbol{\lim_{x \to 0} \left(2^{1/x} + 2^x + \frac{1}{2^x}\right)}\)
\(\boldsymbol{\lim_{x \to \infty} \frac{x}{x+1}}\)
\(\boldsymbol{\lim_{x \to \infty} \frac{3^x-3^{-x}}{3^x+3^{-x}}}\)
\(\boldsymbol{\lim_{x \to \infty} \frac{\sin x}{x}}\)
\(\boldsymbol{\lim_{x \to 0} \frac{\tan^{-1}x}{x}}\)
\(\boldsymbol{\lim_{x \to 0} \sin\left(\frac{1}{x}\right)}\)
1.2.2 Question 2
- A function \(f(x)\) is defined as follows:
\[ f(x) = \begin{cases} 1-x^2 & \text{if } x > 0\\ x+1 & \text{if } x \leq 0 \end{cases}\]
\(\phantom{--}\)Find \(\lim_{x\to0} f(x)\).
- A function \(f\) is defined as follows:
\[ f(x) = \begin{cases} x^2 & \text{when } x <1 \\ 2.5 & \text{when } x = 1 \\ x^2+2 & \text{when } x > 1 \end{cases}\]
\(\phantom{--}\)Does \(\lim_{x\to1} f(x)\) exist?
- A function \(f(x)\) is defined below:
\[ f(x) = \begin{cases} x & \text{if } 0< x <1 \\ 2 - \frac{1}{x} & \text{if } 1 \leq x <2 \\ x-\frac{1}{8}x^2 & \text{if } x > 2 \end{cases}\]
\(\phantom{--}\)Show the existence of the limits at \(x=1\) and \(x=2\). Find \(\lim_{x\to1} f(x)\) and \(\lim_{x\to2} f(x)\) if they exist.